Data Center Grid Interconnection Queue in 2026: 5-Year Waits and 3 Ways Builders Skip the Line
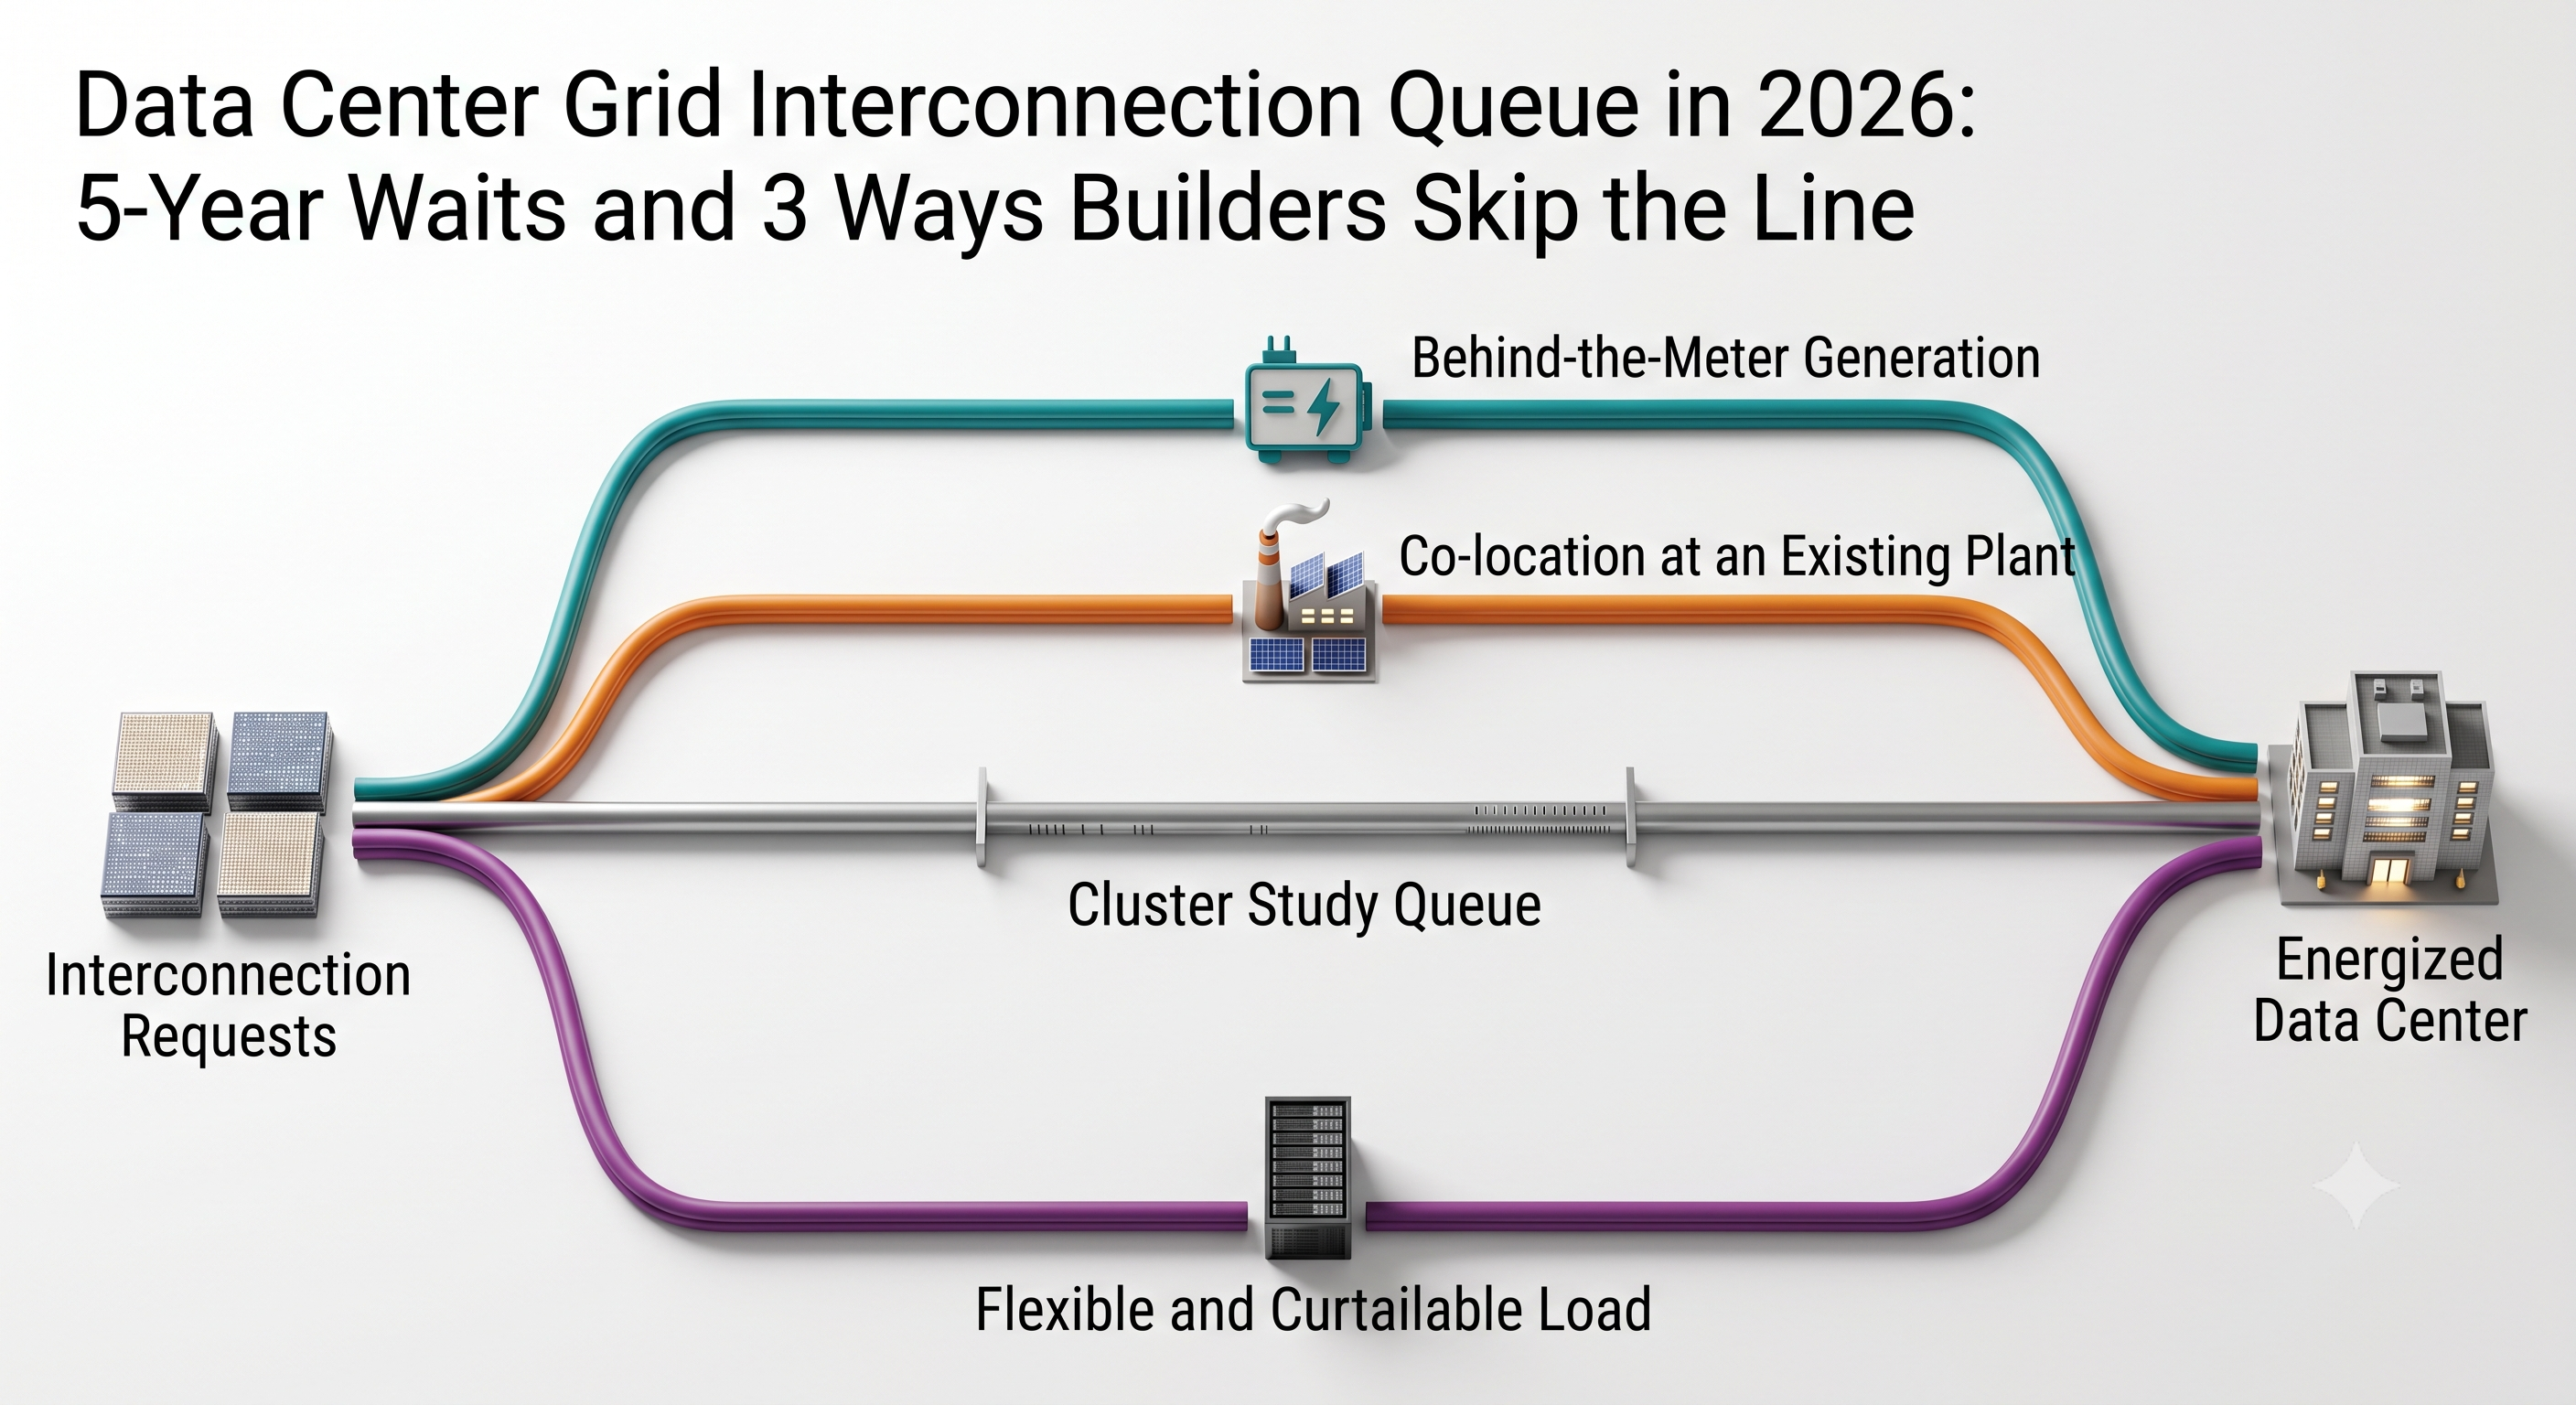
Most AI data centers in 2026 are not waiting on GPUs. They are waiting on a grid connection, and that wait is measured in years. In PJM, the first cycle of the reformed interconnection process closed applications on April 27, 2026 and runs study phases into February 2028 — after which, by PJM's own account, issuing a generation interconnection agreement takes another one to two years. The 51 "shovel-ready" generation projects PJM pulled out of the queue and fast-tracked separately are still targeted at 2030, with all of them due in service by 2031. Federal regulators now say the process is too slow in writing: on June 18, 2026, FERC issued show-cause orders to all six RTOs/ISOs and found that large-load study processes should take no more than 60 to 90 days. The distance between a multi-year queue and a 60–90 day target is the entire story, and it is why three workarounds — on-site generation, co-location, and flexible load — now decide which sites energize first.
By The Whitepaper Skeptic — prepared Korea R&D/TCB filings, ran OT security architecture reviews
Quick Facts
| Question | Answer |
|---|---|
| What is a data center actually waiting for? | Two different queues — the generation interconnection queue for new power plants, and a separate large-load interconnection process for the data center itself |
| How long is the generation queue in PJM? | Cycle 1 applications closed 2026-04-27; study Phase III ends 2028-02-22; PJM says issuing an interconnection agreement then takes one to two more years |
| What does the regulator say the target should be? | FERC (2026-06-18): large-load study processes should take no more than 60–90 days — six show-cause orders, dockets EL26-67-000 through EL26-72-000 |
| How much pressure is in one market? | ERCOT's own large-load queue was about 238.6 GW as of March 2026, 77.5% of it data centers |
| Does going off-grid work? | 59 U.S. data centers have announced roughly 90 GW of behind-the-meter generation; about 2 GW (2.2%) is actually running |
Why the Grid, Not the GPU, Decides Your Energization Date
The dominant framing in tech coverage is scarcity of compute: whoever secures accelerators wins. That framing was roughly right in 2023 and is misleading in 2026. Chips are a purchase order. A grid connection is a regulated queue position with study phases, cost-allocation disputes, and network upgrades that other people have to build.
The second framing error is more damaging because it sounds informed: "the United States doesn't have enough power." Generation capacity is not the binding constraint in most of these markets. The constraint is interconnected, deliverable capacity — power that has cleared a study, has an executed interconnection agreement, and has the transmission upgrades behind it actually energized. Those are different quantities, and treating them as one produces the confident, wrong conclusion that building more gas turbines fixes the timeline.
You can see the gap inside the queue data itself. In LBNL's Queued Up: 2026 Edition — released June 2026, covering queue status as of the end of 2025 — roughly 549 GW of capacity has an interconnection agreement, either drafted or executed, and still has not reached commercial operation: about 256 GW solar, 161 GW storage, 76 GW wind, 45 GW gas. That is capacity that already won its queue fight and is still not delivering electrons. Adding more applications behind it does not move it.
The number most articles get wrong
The single most frequently mangled statistic in this space is the Department of Energy's 100 GW. It is not a forecast of data center demand. DOE's July 2025 Report on Evaluating U.S. Grid Reliability and Security estimates that the grid needs roughly 100 GW of new peak capacity by 2030 across all load growth, of which about 50 GW is attributable to data centers. Cite it as "100 GW of data center demand" and you have doubled the number.
NERC's figures are also routinely stacked next to DOE's as if they measure the same thing. They do not — different publication dates, different units of account, different geographies:
| Figure | What it actually counts | Source and date |
|---|---|---|
| ~100 GW | New peak capacity the grid must add by 2030, all load types combined | DOE, Report on Evaluating U.S. Grid Reliability and Security, July 2025 |
| ~50 GW | The data center share of that 100 GW | DOE, same report |
| 45 GW | Large load expected to interconnect by 2030 — a queue quantity, not a capacity requirement | NERC, 2025 Long-Term Reliability Assessment, released January 2026 |
| 23 GW | The data center share of that 45 GW | NERC, same assessment |
| +224 GW | Ten-year growth in forecast summer peak demand, up more than 69% from the 132 GW the prior year's assessment projected | NERC, same assessment |
These five numbers cannot be added, averaged, or compared against each other. If you see them in a single bar chart, the chart is wrong.
I spent a long stretch of my career on the other side of documents like these — preparing Korean government R&D applications and TCB technology-credit evaluations, where the whole job is reading a public program document and working out what it actually obligates. The discipline that transfers directly here is refusing to plan against a headline total. An announced program figure is a ceiling across several fiscal years, released in annual tranches, each gated on a milestone; the number that belongs in your schedule is the tranche and the gate, not the ceiling. Grid announcements behave identically, which is why the 90 GW versus 2 GW gap later in this article did not surprise me.
Two Queues, Not One
Most coverage collapses "interconnection" into a single line item. There are two processes, they are governed differently, and a data center project can be blocked by either.
| Aspect | Generation interconnection queue | Large-load interconnection |
|---|---|---|
| Who is in it | New power plants, storage, hybrid projects | The data center (or any large new customer) itself |
| What it studies | Whether adding generation at a point destabilizes the system, and what network upgrades that requires | Whether the grid can serve a large new load at that point, and what upgrades that requires |
| Governing process | Long-standing FERC-jurisdictional cluster study processes, reformed under FERC Order 2023 and each RTO's own tariff | Historically handled under state/utility rules and inconsistent RTO tariff provisions — the gap FERC moved on in June 2026 |
| Typical duration | Multi-year: cluster studies in phases, then an interconnection agreement, then construction | Highly variable; FERC's 2026 position is that the study process should not exceed 60–90 days |
| Who pays for upgrades | Cost allocation between the interconnecting project and network customers — often the hardest fight in the process | One of the five reform areas FERC's show-cause orders explicitly raised |
FERC's June 18, 2026 action targeted the second column. It opened show-cause proceedings under Federal Power Act §206 against all six RTOs/ISOs — PJM, MISO, SPP, CAISO, ISO-NE, NYISO — and their transmission owners (dockets EL26-67-000 through EL26-72-000, alongside rulemaking docket RM26-4-000), giving them 60 days to justify their existing tariffs or file revisions. The orders named five reform areas: transmission service application and study processes; cost transparency and protection against cost shifting; co-location arrangements and behind-the-meter generation; new transmission services for flexible large loads; and how generation serving electrically proximate large loads gets studied. FERC also set a benchmark inside the first of those — the study process, it found, should take no more than 60 to 90 days.
What happened next is a useful check on how fast "aggressive" regulatory action actually moves. Rather than answer on the merits by the August 17, 2026 deadline, every one of the six proceedings drew a motion to hold it in abeyance — PJM and its transmission owners filed on July 28, the other five on the August 3 deadline — so each RTO could develop a Federal Power Act §205 filing through its own stakeholder process instead. FERC has been granting those requests while capping them at 90 days; CAISO, which has already sketched two flexible interconnection services and a 50 MW large-load threshold, expects to make its §205 filing by November 16, 2026. Nothing here is settled tariff language yet, and a builder planning against the 60–90 day number is planning against a finding, not a rule.
Why this distinction matters practically: a site can have a perfectly clear large-load path and still be dark because the generation that was supposed to serve it is stuck three phases deep in the other queue — or vice versa. Asking your utility "where am I in the queue" without specifying which queue produces an answer you cannot plan against.
The Actual Clock: What PJM's First Reformed Cycle Tells You
PJM's Cycle 1 is the most legible timeline available right now, because it is the first cohort to run entirely through the reformed cluster process and every milestone is published in advance.
| Milestone | Date | What it means for a project in this cycle |
|---|---|---|
| Application deadline | 2026-04-27 | Entry closed; 811 projects totaling about 220 GW applied |
| Application review | 2026-04-28 – 2026-07-27 (91 days) | Completeness and eligibility screening — no system results yet. PJM announced the outcome on 2026-08-03: 715 projects, 201.5 GW accepted; roughly 96 applications did not survive validation |
| Phase I study | 2026-07-28 – 2026-11-24 (120 days) | First decision point at the end of November 2026; withdrawals reshape the cluster |
| Phase II study | 2027-01-28 – 2027-07-26 (180 days) | Upgrade requirements and cost allocation start to firm up; second decision point end of July 2027 |
| Phase III study | through 2028-02-22 | Final study results, then a final decision point in February 2028 |
| Interconnection agreement | 2029 onward | PJM says issuing a generation interconnection agreement now takes one to two years after studies complete. Only at that point does a project have an executable contract |
| Construction and energization | After the IA | Equipment lead times and site work begin from here, not from the application date |
The accepted Cycle 1 technology mix is itself informative about what developers expect to get built: 147 gas projects at 99.8 GW, 314 storage projects at 60.0 GW, 24 nuclear units at 17.3 GW, 117 solar at 11.8 GW, 37 solar-plus-storage at 7.5 GW, and 61 wind at 3.9 GW. Gas dominates the megawatts. That matches the one directional change visible in the national queue data: gas was the only technology whose active capacity grew in 2025, reaching 253 GW (+86% year over year) while solar (773 GW, -19%), storage (749 GW, -16%), and wind (220 GW, -19%) all shrank.
Our estimate, not an official projection: a project that applied in the April 2026 window finishes Phase III in February 2028, signs an interconnection agreement in 2029 (PJM's own one-to-two-year GIA window), and then needs roughly two years of construction — putting first power around 2031. That arithmetic is ours. PJM has published no 2031 date for Cycle 1, and no agency forecast says this. The number that is official points the same direction: under the Reliability Resource Initiative announced in May 2025, PJM pulled 51 shovel-ready projects totaling more than 9,300 MW of unforced capacity out of the normal queue specifically to accelerate them — and even there, 90% are expected online by 2030 and the rest by 2031. When the fast lane arrives in 2030, the regular lane is not arriving sooner.
One narrower correction, because these numbers get welded together constantly. PJM's own average queue wait is about 40 months (roughly 3.3 years), with active projects in high-data-center-growth zones running 36–48 months, per Carbon Direct's May 2026 analysis. The "seven years" figure that circulates is not a national average: JLL's 2026 Global Data Center Outlook puts the average wait for a 100 MW connection in Northern Virginia at seven years, against a four-year U.S. average. The national figure that does exist is LBNL's, and it is a median, not an average — for projects that reached commercial operation in 2025, the median time from interconnection request to energization was more than five years, up from more than four years for the 2018–2024 cohort, with the median request-to-interconnection-agreement leg alone running well over three years. So: seven years is a market, five-plus years is a national median, and 40 months is PJM's average. Quoting any one of them as the others, or attributing the seven-year number to PJM, is wrong.
Texas: What Happens When Large-Load Requests Outrun the Process
ERCOT is the stress test, because interconnection there is faster than in most RTOs and the demand still overwhelmed the planning process.
ERCOT's own accounting put its large-load queue at about 238.6 GW as of March 2026, with 77.5% of that attributable to data centers. In the first quarter of 2026 alone, roughly 198 GW of new large-load requests arrived. In an August 3, 2026 letter, Governor Abbott cited a figure of 474 GW of interconnection requests, about 90% of them data centers — more than five times ERCOT's all-time peak demand. That 474 GW number comes from the governor's letter, not from an ERCOT published queue report, and should always be attributed that way.
The governor's letter also directed a full audit of the queue, and the machinery stopped the same day. ERCOT issued Market Notice M-A080326-01 suspending the Batch Zero large-load classification notices that had been due August 7, then asked the Public Utility Commission of Texas for good-cause exceptions to the Planning Guide deadlines it was about to miss. The PUCT granted them on August 20, 2026. As of this writing the audit is still running: ERCOT is issuing information requests to roughly 300 data centers of 75 MW or larger, targets a report to the PUCT in early December 2026, and has said the April 9, 2027 deadline for Batch Zero study results will not be met — with no replacement date set. A single letter moved a study deadline by an unknown number of quarters, which is worth holding next to any vendor timeline that treats ERCOT as the fast market.
The lesson is not "Texas is broken." It is that request volume and buildable load are almost unrelated quantities. A queue that contains five times the system's record peak is not a demand forecast; it is a measure of how cheap it is to file. Any market that makes queue entry free will produce a number like this, and any analysis that treats that number as demand will overbuild against a phantom.
Three Ways Builders Skip the Line
Three workarounds are actually in use. Each one maps onto a reform area FERC named in June 2026, which is a reasonable check that the list is neither invented nor padded.
| Route | What it is | Real constraint | Where it stands in 2026 |
|---|---|---|---|
| Behind-the-meter generation | On-site generation serving the load directly, islanded or with minimal grid service | Fuel supply, air permits, equipment lead times, and a new operating discipline the owner did not previously have | 59 sites, ~90 GW announced; ~2 GW (2.2%) operating |
| Co-location at an existing plant | Siting adjacent to an existing nuclear or gas plant and taking power directly | Unsettled rules on what the co-located load owes the transmission system | Explicitly named as an issue in FERC's June 2026 show-cause orders |
| Flexible / curtailable load | Accepting contractual curtailment in exchange for faster interconnection | Requires the ability to actually shed or shift load without breaking SLAs | FERC directed the RTOs to develop new transmission services for flexible large loads; the commercially hottest of the three |
The behind-the-meter numbers deserve a close read, because they are the cleanest example in the industry of an announcement-versus-execution gap. According to Cleanview's behind-the-meter tracker (accessed 2026-09-10 — this is a continuously updated tracker, so always record your access date), 59 U.S. data centers have announced on-site generation totaling about 90 GW, more than a quarter of all planned U.S. data center capacity, and roughly 92% of those projects were announced after early 2025. About 2 GW — 2.2% — is actually running, with another 1.2% under construction and 36% through permitting. The tracker's own near-term projection is 2.8–3.2 GW operating by the end of 2026; for the end of 2027 it gives a range rather than a number, roughly 5 GW in its pessimistic case and 13 GW in its optimistic one. That spread is the honest answer to "when does this capacity arrive."
The largest operating example is xAI's Colossus 1 and 2 in Memphis at 1,498 MW of gas turbine capacity. The equipment mix across the portfolio is telling: truck-mounted mobile generators, aeroderivative turbines, reciprocating engines, and refurbished industrial turbines, with reciprocating-engine and fuel-cell vendors holding the largest single shares of announced supply. Siting is concentrated in a handful of states rather than spread across the country. This is not utility-scale plant construction. It is whatever can be trucked in and permitted quickly — and permitting is where these projects have actually been dying, from blocked gas pipelines to contested air permits.
So the honest version of "skip the line" is: about one out of every forty-five announced behind-the-meter megawatts is producing electricity today. The route works. It just does not work at the speed the announcements imply, and a site plan that assumes otherwise has the same defect as a funding plan built on a headline grant number.
The Part Nobody Prices In: Behind-the-Meter Power Is an OT Problem
Here is the angle I have not seen in the energy-trade or tech coverage, and it is where my own hands-on work comes closest to the subject.
Behind-the-meter generation is usually framed as a procurement decision — buy turbines, skip the queue. It is more accurately a transfer of operational responsibility. The day a data center takes delivery of its own generation, it acquires turbine and engine control systems, protective relaying, plant SCADA, and the vendor remote-access paths that come attached to all of them. An IT asset estate becomes an IT estate plus an OT estate, and those are not managed the same way. (If that distinction is new, the OT Cybersecurity 101 piece covers why availability-first environments break IT security assumptions.)
In the OT security architecture reviews I have run on live industrial networks, the finding was almost never an exotic vulnerability. It was that nobody had a complete list of what was on the network. The list that existed was the list somebody had built during commissioning, and the network had kept growing after that: engineering workstations, contractor laptops, serial-to-Ethernet converters, a vendor's monitoring appliance installed during a warranty visit and never recorded anywhere. Drawing IEC 62443 zone and conduit boundaries is a thirty-minute exercise on a slide and a months-long exercise against a real plant, because every conduit you draw is a claim that you know both endpoints — and an incomplete inventory means you do not. Working through that in detail is what the OT asset inventory piece is about.
Now apply that to an on-site power plant. The turbine OEM will want persistent remote support access; that is a conduit you must define or your zone model does not exist. The plant's protection scheme has to coordinate with a load that can swing by hundreds of megawatts in seconds. NERC's 2026 State of Reliability (June 2026) flagged exactly this — two customer-initiated data center load reductions above 1,000 MW in a single year, named as a new grid reliability risk, alongside a rise in conventional generation forced-outage rates to 9.2%, above the historical 7–8% range, with a separate NERC alert issued on sudden data center load loss. Those swings are not an abstract grid statistic when you own the generation: they are a control, instrumentation, and telemetry problem inside your own fence line, and you are now the one who has to solve it.
I have never run a generation interconnection or filed with an RTO, and nothing here should be read as that kind of expertise. But the asset-inventory failure mode transfers exactly, and it is the predictable one: the organization that could not enumerate a single production line's devices is now responsible for a power plant's control network, on a schedule set by a data center opening date.
Worth noting on the demand side too: the reason rack-level power density climbed steeply enough to create this problem at all is a packaging and thermal story I have covered from the chip side — HBM stacking and package TDP driving liquid cooling adoption, with interconnect efficiency work like co-packaged optics and memory approaches like CXL pooling functioning as the demand-side counterpart to everything above. Every watt per bit you save is a megawatt you do not have to queue for.
FAQ
Q: How long does a data center interconnection take? A: It depends which queue you mean. For the generation serving the site, PJM's first reformed cycle gives a published path: applications closed April 27, 2026, the final study phase ends February 22, 2028, and PJM says issuing an interconnection agreement then takes another one to two years, with construction after that. Nationally, projects reaching commercial operation in 2025 took a median of more than five years from interconnection request to energization, worse than the four-plus years recorded for the 2018–2024 cohort. For the data center's own large-load connection, FERC found in June 2026 that the study process should take no more than 60 to 90 days — which is a finding in a pending proceeding, not current practice or settled tariff language.
Q: What is behind-the-meter power for a data center? A: Generation built on the customer's side of the utility meter that serves the data center directly, either fully islanded from the grid or with limited grid interaction. In 2026 it is the most-announced way to avoid the interconnection queue: per Cleanview's tracker, 59 U.S. sites have announced roughly 90 GW, about 92% of those projects since early 2025. The catch is execution — only about 2 GW (2.2%) is operating, with 1.2% under construction and 36% through permitting.
Q: How big is the ERCOT large load interconnection queue? A: ERCOT's own figure was about 238.6 GW as of March 2026, with 77.5% attributable to data centers, and roughly 198 GW of new large-load requests arrived in the first quarter of 2026 alone. A larger figure of 474 GW, about 90% data centers, comes from Governor Abbott's August 3, 2026 letter rather than an ERCOT queue report. Queue volume is not a demand forecast — filing is cheap, and most of it will never be built.
Q: What are the rules for co-locating a data center next to a power plant? A: Still unsettled as of September 2026. FERC's June 18, 2026 show-cause orders named co-location arrangements and behind-the-meter generation as one of five reform areas the RTOs must address, and separately required them to explain how generation serving electrically proximate large loads gets studied — itself the clearest signal that existing tariff treatment is inconsistent. No RTO has yet answered on the merits: all six proceedings were held in abeyance, capped at 90 days, so the operators could develop Federal Power Act §205 filings instead. CAISO's is expected by November 16, 2026. Until those filings are made and acted on, there is no settled national answer.
Q: What is a flexible or curtailable load agreement for data centers? A: A contract in which the data center accepts the obligation to reduce or shift load under defined grid conditions, in exchange for a faster or cheaper interconnection than a firm-service request would get. FERC's June 2026 orders directed every RTO to develop new transmission services for flexible large loads — one of five reform areas named. It is the workaround with the lowest capital cost and the highest operational cost, because the ability to actually shed load without violating customer service commitments has to be engineered, not just signed.
Sources
- Lawrence Berkeley National Laboratory, Queued Up: 2026 Edition — Characteristics of Power Plants Seeking Transmission Interconnection As of the End of 2025 (published 2026-06-30) — (OSTI record: https://www.osti.gov/biblio/3376147) — source of the 549 GW IA-but-not-operating figure, the 253 GW / +86% gas figure, and the median request-to-operation durations
- American Public Power Association, "Backlog of Power Plants Seeking Transmission Grid Connection Eased Somewhat in 2025: LBNL" — — secondary confirmation of the LBNL figures above (emp.lbl.gov blocks automated retrieval)
- FERC, "FERC Launches Aggressive Targeted Action to Speed Large Load Integration" (news release, 2026-06-18) —
- FERC, Interconnection of Large Loads to the Interstate Transmission System, docket RM26-4-000 —
- PJM Inside Lines, "PJM Announces Application Deadline for First Cycle of New Interconnection Process" —
- POWER Magazine, "PJM's First Reformed Queue Cycle Draws 811 Projects, 220 GW" —
- PJM Inside Lines, "Over 700 New Generation Projects Accepted Into First Cycle of Reformed Interconnection Process" (2026-08-03) — — source of the 715 projects / 201.5 GW accepted figures and the accepted technology mix
- PJM Inside Lines, "PJM Chooses 51 Generation Resource Projects To Address Near-Term Electricity Demand Growth" (Reliability Resource Initiative, 2025-05-02) —
- Carbon Direct, AI Meets the Grid: Interconnection Queue Analysis in PJM and ERCOT (May 2026) — — source of the ~40-month PJM average and the 36–48 month data-center-zone range
- JLL, 2026 Global Data Center Outlook — — source of the seven-year Northern Virginia figure and the four-year U.S. average
- McGuireWoods, "FERC Issues Section 206 Show Cause Orders Directing All Six RTOs/ISOs to Justify or Reform Large Load Integration Rules" (June 2026) — — docket numbers and the five reform areas (ferc.gov blocks automated retrieval)
- Holland & Knight, "FERC Advances New Oversight Framework for Large Loads" (June 2026) — — independent confirmation of the same five reform areas
- U.S. Department of Energy, Report on Evaluating U.S. Grid Reliability and Security (2025-07-07) —).pdf — source of the ~100 GW new peak capacity figure and the ~50 GW data center share
- NERC, 2025 Long-Term Reliability Assessment (released 2026-01-29; PDF cover dated January 2026) — — source of the +224 GW ten-year summer peak growth and the 45 GW / 23 GW large-load figures. The
_2025in the filename is the assessment year, not the publication month; the companion infographic is at https://www.nerc.com/globalassets/our-work/assessments/ltra_infographic_2025.pdf - NERC, 2026 State of Reliability — overview PDF: — source of the 9.2% conventional forced-outage rate and the >1,000 MW data center load-reduction events
- ERCOT, Large Load Integration —
- ERCOT, Large Load Update, Senate Committee on Business & Commerce (2026-04) —
- Cleanview, Behind-the-Meter Data Centers tracker — — continuously updated; figures in this article were taken on 2026-09-10
- ERCOT Market Notice M-A080326-01, "Update Regarding Batch Zero Timelines" (2026-08-03) —
- ERCOT Market Notice M-A080326-02, "PUC Approval of Good Cause Exceptions" (2026-08-20) —
- Utility Dive, "Facing an estimated 474 GW of interconnection requests, Texas hits pause on data centers" (2026-08-05) — — source for the Abbott letter's 474 GW / ~90% figures
- Utility Dive, "ERCOT aims to complete Texas governor's data center audit by December" — — source for the PUCT August 20 approval, the ~300 data centers ≥75 MW under review, and the slipped April 9, 2027 Batch Zero deadline
Author Bio
No utility, RTO, or interconnection-filing experience is claimed here. Every queue mechanic above is read off public dockets, published cycle calendars, and primary agency reports, and it is attributed that way in the text. Two habits do the work instead: years of Korean government R&D applications and TCB technology-credit evaluations, which is training in telling an announced ceiling apart from the tranche that actually lands in a given fiscal year; and OT security architecture reviews on live industrial networks, a job that mostly consists of discovering that no complete list of connected devices exists. The first habit is why 90 GW of announced behind-the-meter capacity against roughly 2 GW operating looks ordinary rather than shocking. The second is why the on-site generation section deals in asset registers, vendor remote access, and IEC 62443 zone boundaries instead of in turbines. What a data center inherits on the day it starts generating its own power is that inventory problem, not the generation expertise.
Related Posts
- 800 VDC Data Center Power Architecture Explained: 45% Less Copper and the 2027 Rack Deadline
- AI Data Center Liquid Cooling: Why HBM and GPU Power Density Broke Air Cooling
- OT Cybersecurity 101: Why Smart Factories Need a Different Security Model Than IT
- OT Asset Management: How to Build an Industrial Asset Inventory When You Don't Know What's on the Network
- Co-Packaged Optics Explained: How Silicon Photonics Cuts AI Data Center Power 3.5x in 2026
- CXL Explained: How Memory Pooling Fixes What HBM Can't Solve in 2026 AI Data Centers
Tags
data center interconnection, grid interconnection queue, behind-the-meter generation, FERC, AI data center power


Comments
Post a Comment