OT Cybersecurity Budget Benchmarks 2026: What Manufacturers Actually Spend on IT vs. OT Security
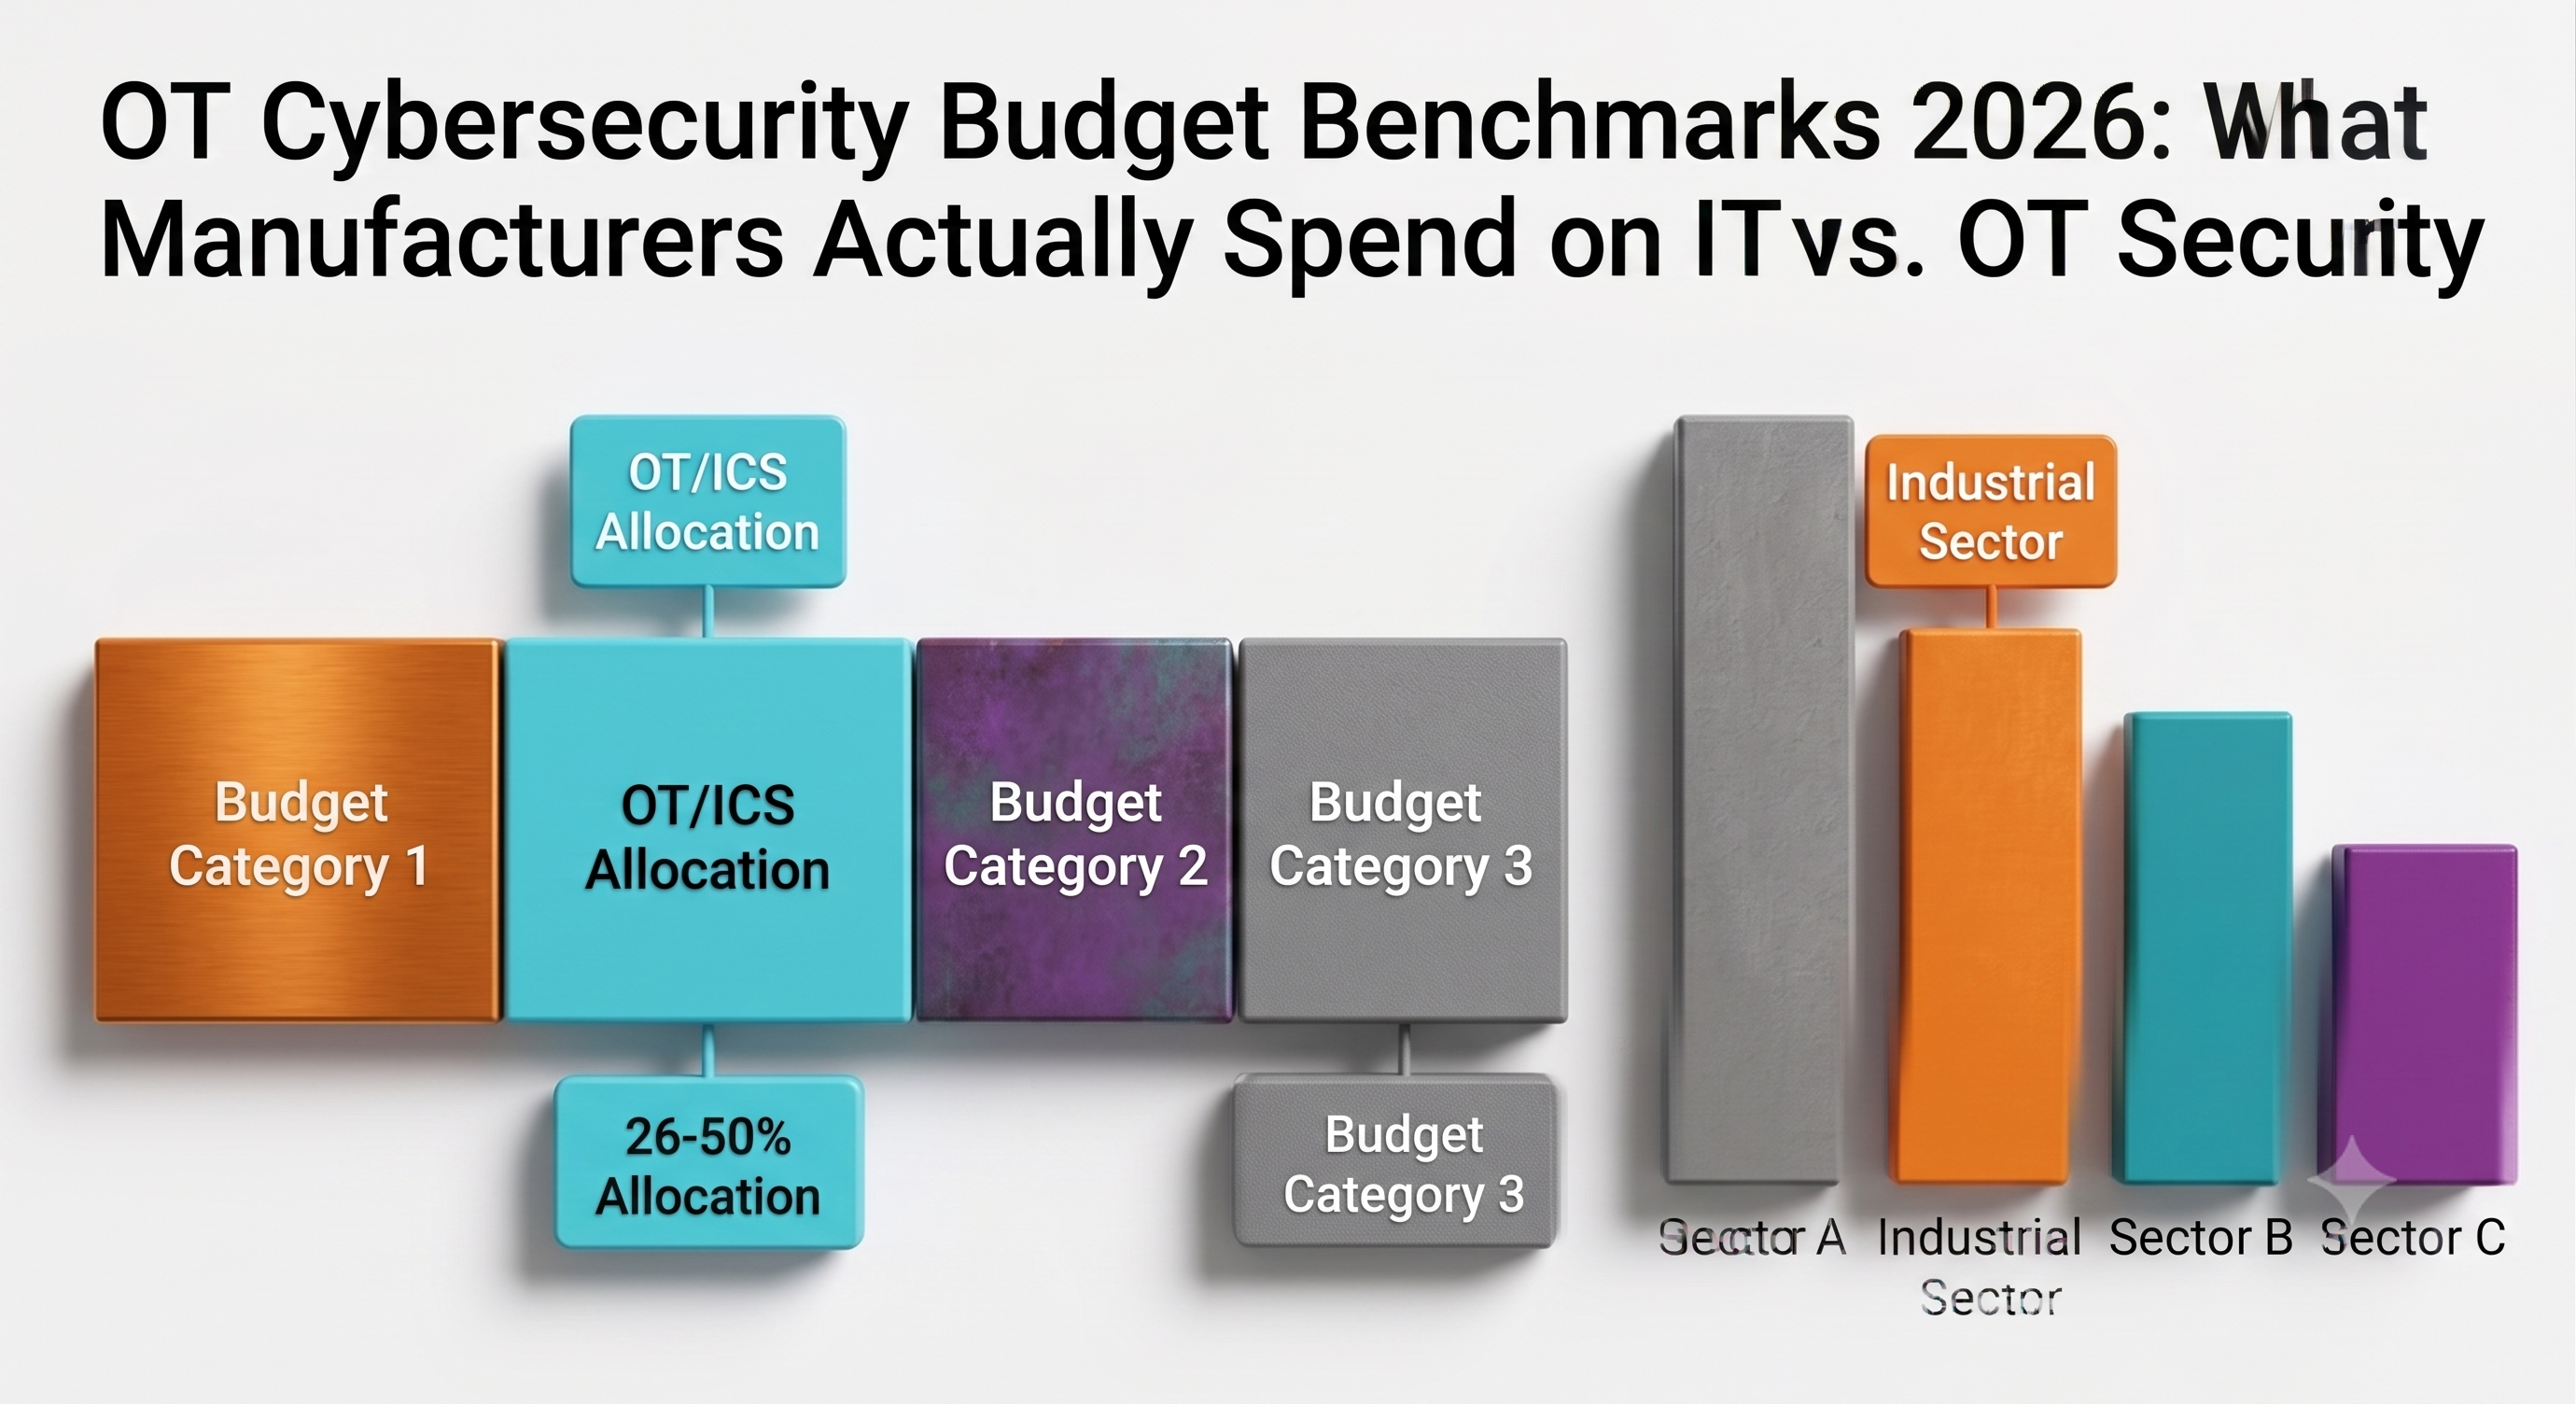
There's no single "correct" percentage, but the most rigorous primary data available for 2026 puts the typical allocation at 26-50% of the total cybersecurity budget for ICS/OT — the largest single bucket in both the US (40% of respondents) and Europe (38%), per the SANS Institute/OPSWAT 2025 ICS/OT Cybersecurity Budget survey. The number that should worry budget holders more than any allocation percentage is what underinvestment actually costs: the industrial sector's average data breach in 2026 ran $5.5 million, per IBM's Cost of a Data Breach Report 2026 — the third-highest average of any sector IBM tracked (tied with technology), behind only healthcare ($6.64 million) and financial services ($6.3 million). This article breaks down the primary survey data behind that allocation figure, clears up two breach-cost numbers that get miscited across the industry, and covers where an approved OT security budget actually goes once the check is signed.
Quick Facts
| Question | Answer |
|---|---|
| What's the most common OT/ICS budget allocation bucket? | 26-50% of the total cybersecurity budget — the largest single bucket in the US (40% of respondents) and Europe (38%), per SANS/OPSWAT 2025 |
| What's the global average cost of a data breach in 2026? | $4.99 million, up 12% year-over-year (IBM Cost of a Data Breach Report 2026) |
| What's the industrial sector's average breach cost specifically? | $5.5 million — third-highest of all sectors surveyed (tied with technology), behind healthcare ($6.64 million) and financial services ($6.3 million) |
| Is there one universal "X% of IT budget" rule for OT security? | No verified single figure exists — allocation varies by bucket and region; treat any single-number claim skeptically unless it cites its source's actual methodology |
| Where does most of an OT security budget go once approved? | Segmentation/DMZ infrastructure, passive monitoring platforms, asset inventory tooling, and incident response retainers, in roughly that order of first-year spend, based on practitioner experience |
How Much of the Cybersecurity Budget Should Go to OT? The SANS/OPSWAT 2025 Data
A figure that circulates informally in industry write-ups claims manufacturers should put "18-26%" of their cybersecurity budget toward OT. That specific range does not trace back to any single primary survey — it appears to be an unattributed blend of two different things: general (non-OT-specific) cybersecurity-as-a-share-of-IT-budget benchmarks commonly cited for regulated industries (10-15% typical across most industries, 15-18% for regulated/high-threat sectors, per aggregator sources like Elisity and ITBudgetCalculator, which do not attribute those specific bands to a named primary research firm) and the lower edge of a completely different, OT-specific dataset described below. The one figure in this space that does trace to a named analyst firm is both lower and older than either aggregator band: Gartner's IT Key Metrics Data, as cited by Gartner analysts in press coverage, put average IT security spend at roughly 5.6-6.2% of the overall IT budget (a reported range of 1-13% across organizations) with banking and financial services specifically at 7.6% — but that data point comes from Gartner commentary published between 2016 and 2020, and no more recent Gartner-sourced percentage could be confirmed for 2026. Treat any single "X-Y%" figure you see quoted as an OT budget rule of thumb with the same skepticism.
The actual primary data on OT/ICS-specific budget allocation comes from the SANS Institute/OPSWAT 2025 ICS/OT Cybersecurity Budget survey (180 respondents across critical infrastructure sectors). Rather than a single blended percentage, it reports allocation in discrete buckets of the overall cybersecurity budget devoted specifically to ICS/OT:
Share of respondents whose largest single OT/ICS allocation bucket was 26-50% of the total cybersecurity budget
| Region | Share of respondents in the 26-50% bucket |
|---|---|
| United States | 40% |
| Europe | 38% |
Share of respondents allocating more than half their cybersecurity budget to OT/ICS (the 51-100% bucket) — rare everywhere surveyed
| Region | Share allocating 51-100% to OT/ICS |
|---|---|
| United States | 12% |
| Africa | 17% |
| ANZ (Australia/New Zealand) | 17% |
Two takeaways from this data that a single blended percentage would hide: first, 26-50% is a bucket, not a point estimate — organizations inside it could be spending anywhere from just over a quarter to half of their cybersecurity budget on OT, and the survey doesn't narrow that further. Second, allocating more than half the cybersecurity budget to OT/ICS remains uncommon everywhere surveyed, which is a useful reality check for OT security leads who feel like they're always asking for "too much."
What a Data Breach Actually Costs: Global vs. Industrial vs. On-Premises
IBM's Cost of a Data Breach Report 2026 (published July 29, 2026; based on Ponemon Institute research covering 602 organizations across 16 countries/regions and 17 industries, with breach data collected March 2025-February 2026 — confirmed via IBM's own newsroom release and cross-checked against Help Net Security and Northdoor coverage of the report after direct access to ibm.com/reports/data-breach returned 403 during research) contains three genuinely different cuts of the same underlying data that get conflated with each other constantly in secondary coverage. They should not be blended or used interchangeably:
| IBM 2026 report cut | Average breach cost | Year-over-year change |
|---|---|---|
| Global average, all sectors and deployment types | $4.99 million | +12% |
| Industrial sector average | $5.5 million | +10% (up from $5.0 million in the prior report) |
| On-premises deployment subset, all sectors | $4.56 million | +12% |
The most important distinction here: the $4.56 million on-premises figure is not an OT-specific or manufacturing-specific number. It's IBM's reported average cost for breaches where the compromised environment was deployed on-premises — a cut by infrastructure location, applied across every industry in the survey, not a cut by industry sector. At least one secondary aggregator already mislabels this figure as "OT breach cost" or "manufacturing breach cost" online — it is neither. If you see $4.56 million cited as an OT-specific number anywhere, including in older coverage of this same report, that citation is incorrect.
The figure that actually represents the industrial sector is $5.5 million — the third-highest average breach cost of any sector IBM tracked in the 2026 report (tied with technology), behind healthcare at $6.64 million and financial services at $6.3 million (confirmed via eSecurityPlanet's and Northdoor's coverage of the report after ibm.com/think/insights/cost-of-a-data-breach-industrial-sector also returned 403 during research). That's the number worth citing in a budget conversation about manufacturing or industrial risk specifically — not the global average, and not the on-premises subset.
For more detail on what OT/IT segmentation failures cost in practice, see Manufacturing Ransomware Case Studies: What OT/IT Segmentation Failures Actually Cost.
Where the Money Actually Goes: A Practitioner's Breakdown of OT Security Spend
Vendor blog posts about OT security budgets tend to converge on one message: buy our platform first. In practice, across the security architecture reviews this author has run for industrial and smart-factory environments, first-year OT security spend tends to land on a fairly consistent set of line items, roughly in this order of priority:
- Segmentation and DMZ infrastructure. Building the network boundary between IT and OT — firewalls, industrial DMZs, and the switching/routing changes needed to enforce zones and conduits — is typically the largest single capital line item, because it's foundational to nearly everything else in an IEC 62443-aligned program. For a deeper look at how zones and conduits are actually designed, see IEC 62443 Zones and Conduits Explained. One IEC 62443 implementation cost figure worth flagging with a caveat: a commonly cited range of $3-8 million and 18-36 months for mid-sized facilities circulates widely, but no primary study backs this specific range the way the SANS/OPSWAT allocation data above is backed. It traces only to secondary calculator/aggregator sources (itbudgetcalculator.com among them); other secondary estimates found for comparable facility profiles during this research vary by roughly an order of magnitude, so no reliable industry-consensus figure has emerged. Treat the $3-8 million range as one secondary estimate among several inconsistent ones — directionally useful at best, not an authoritative benchmark.
- Passive monitoring platforms. Once segmentation exists, ongoing visibility into what's crossing those boundaries — and what's happening inside each zone — becomes the next priority, typically funded as an annual subscription/licensing line rather than a one-time capital purchase.
- Asset inventory tooling. Asset visibility is consistently the first gap identified in a security architecture review, and it's frequently underfunded relative to how foundational it is — every other security control, from segmentation to monitoring, depends on knowing what's actually on the network. See OT Asset Management: How to Build an Industrial Asset Inventory for a vendor-neutral starting sequence.
- Incident response retainers. A pre-negotiated IR retainer with OT-specific expertise is a smaller recurring line item than the above, but it's the one most often skipped by budget-constrained programs — and the one whose absence is most visible after an incident, when negotiating IR terms under active pressure costs both more money and more downtime than negotiating them in advance.
How to Justify an OT Security Budget Increase to Leadership
Three arguments tend to land better than a generic "we need more security spending" ask:
- Anchor to the industrial-sector breach cost, not the global average. $5.5 million (industrial sector) is a more defensible number in a manufacturing-specific budget conversation than $4.99 million (global average across all industries) — and both are more defensible than the frequently misused $4.56 million on-premises figure, which isn't a sector number at all.
- Benchmark against the SANS/OPSWAT allocation buckets, not a single percentage. If your organization is currently below the 26-50% bucket that's most common in the US and Europe, that gap — not an invented universal target — is the actual benchmarking argument.
- Tie the specific ask to a specific line item. "We need more security budget" is a hard ask to approve. "We need budget for passive monitoring coverage on the two production lines our asset inventory review flagged as unmonitored" is a specific, fundable request tied to a documented gap.
FAQ
Q: What percentage of IT budget should go to OT security?
A: There's no single verified figure. General (non-OT-specific) cybersecurity-as-a-share-of-IT-budget benchmarks commonly cited for 2026 cluster around 10-15% for most industries and 15-18% for regulated/high-threat sectors, per aggregator sources — not a named primary research firm. For OT/ICS specifically, the SANS Institute/OPSWAT 2025 survey found 26-50% of the total cybersecurity budget is the most common allocation bucket in the US (40% of respondents) and Europe (38%), with allocations above 51% remaining rare everywhere surveyed.
Q: What's the average cost of a data breach in manufacturing in 2026?
A: The industrial sector averaged $5.5 million per breach in IBM's Cost of a Data Breach Report 2026 — the third-highest of any sector (tied with technology), behind healthcare ($6.64 million) and financial services ($6.3 million). This is distinct from IBM's global average across all sectors ($4.99 million, up 12% year-over-year) and from IBM's on-premises-deployment subset ($4.56 million), which is often mislabeled online as an OT-specific figure but is actually a cut by infrastructure location applied across every industry, not a sector-specific number.
Q: How much does IEC 62443 implementation cost?
A: A commonly cited range for mid-sized facilities is $3-8 million over 18-36 months, but this figure traces only to secondary aggregator/calculator sources rather than a named primary study. Other secondary estimates found for comparable facility profiles vary by roughly an order of magnitude, so no reliable industry-consensus figure exists. Treat the $3-8 million range as directionally useful at best, not an authoritative benchmark.
Q: How do I justify an OT security budget increase to leadership?
A: Anchor the ask to the industrial-sector breach cost ($5.5 million, not the global average or the on-premises subset), benchmark your current allocation against the SANS/OPSWAT bucketed data instead of an invented universal percentage, and tie any specific budget request to a documented gap — such as an unmonitored production line identified during an asset inventory review — rather than a general request for "more security spending."
Q: Is spending 26-50% of the cybersecurity budget on OT normal?
A: Yes, per the SANS Institute/OPSWAT 2025 survey, 26-50% of the total cybersecurity budget is the largest single allocation bucket among ICS/OT organizations surveyed in both the US and Europe. Allocating more than half the budget to OT/ICS (the 51-100% bucket) remains rare everywhere surveyed — roughly 12-17% of respondents depending on region.
Sources
- SANS Institute / OPSWAT, "2025 ICS/OT Cybersecurity Budget: Spending Trends, Challenges, and the Future" — primary survey, 180 critical-infrastructure respondents; source of the bucketed allocation data by region
- SecurityWeek, "ICS/OT Security Budgets Increasing, but Critical Areas Underfunded: Report" — secondary coverage directly quoting the SANS/OPSWAT survey figures, useful cross-check if the primary PDF is hard to parse
- IBM, "Cost of a Data Breach Report 2026" — primary source for the $4.99 million global average and $4.56 million on-premises figures; direct access returned 403 during research, so these figures were cross-checked against IBM's own newsroom release and secondary coverage (Help Net Security, Northdoor, eSecurityPlanet) before use
- IBM, "Cost of a data breach: The industrial sector" — primary source for the $5.5 million industrial-sector average; direct access returned 403 during research, so this figure and its ranking against other sectors were cross-checked against eSecurityPlanet's and Northdoor's coverage of the same IBM report before use
- IBM Newsroom, "IBM Study: One in Four Malicious Breaches are AI-Enabled, Costing Companies $6 Million on Average" — IBM's own press release, used to confirm the report's publish date (July 29, 2026) and sample size (602 organizations, 16 countries/regions, 17 industries) when the report pages themselves returned 403
- eSecurityPlanet, "IBM 2026 Cost of a Data Breach Report: Key Findings" — secondary coverage confirming the full sector ranking (healthcare $6.64M, financial services $6.29M, technology and industrial tied at $5.50M) and the industrial sector's year-over-year change (up from $5.0M)
- Northdoor, "IBM Cost of a Data Breach Report 2026: Global Headline Numbers" — secondary coverage cross-checking the sector ranking, sample size, and breach-data collection window
- Infosecurity Magazine, "The Average Cost of a Data Breach Rises to $5 Million" — secondary coverage of the IBM 2026 report, useful cross-check for the $4.99 million global figure
- Cybersecurity Dive, "Security accounts for just 5.7% of IT spend: Gartner" — secondary coverage of Gartner's IT Key Metrics Data (2016-2020-era commentary), the source of the named-analyst-firm IT-security-spend percentages cited above as a lower, dated counterpoint to the unattributed "18-26%" figure
- ITBudgetCalculator.com — secondary aggregator source; used only for the flagged, unverified IEC 62443 implementation cost/timeline range, explicitly caveated above
Author Bio
The Whitepaper Skeptic has direct experience with OT cybersecurity in industrial and smart-factory environments, including customer-facing security architecture reviews where budget conversations consistently followed the same pattern described above: segmentation and DMZ infrastructure absorbed the largest share of first-year spend, while asset inventory tooling — despite being the prerequisite for everything else — was the line item most often proposed for cutting first.


Comments
Post a Comment